Ever feel like social media is running the world? Well, it kind of is. With billions of people scrolling, liking, and sharing daily, social platforms have become more than just a pastime.
In 2025, social media will continue to be an integral part of daily life, influencing communication, business, and culture globally. On average, people spend 2 hours and 21 minutes on social media (YouTube’s average time is only 48 minutes! 😮). This makes social media an unignorable way to promote your business.
So, if you’re not paying attention to the numbers behind it, you’re already falling behind. Let’s know why these statistics matter.
Note: Here, we focus on social media that is most used by average people (e.g. Facebook, Instagram), not by professionals. (e.g. LinkedIn)
Here We Discuss…
The Importance of Social Media Statistics
If you are an influencer or a businessman, know why these Statistics are important for you and what benefits you can get from them.
- If you’re a business, knowing the latest small business social media statistics helps you market smarter and sell more.
- If you’re an influencer or content creator, understanding Gen Z social media statistics tells you where to post and when.
- If you’re in marketing, tracking social media growth helps you predict trends and optimize strategies.
- Even if you’re just a casual user, knowing how many people use social media daily gives insight into how much these platforms shape society and your mindset.
This isn’t just about numbers, it’s about making unmistakable decisions. Whether you’re analyzing trends or building your digital strategy, these insights will keep you ahead in 2025’s fast-changing social media world.
Let’s break down some of the most important numbers.
Global Social Media Usage: The Big Picture
Social media is bigger than ever, and it’s still growing. Here’s where we stand in 2025:
How Many People Use Social Media?
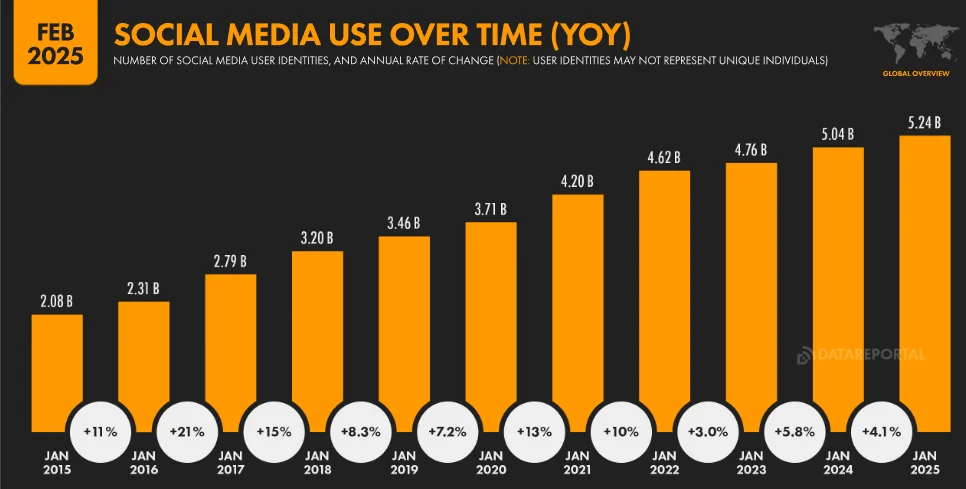
According to Datareportal, in 2025, over 5.24 billion users were active on social platforms. Where, the average internet user has accounts on 6.83 social media platforms.
😮 Fun Fact: Less than 4% of internet users don’t use social media. Because this percentage of the population doesn’t use smartphones.
What Percent Of People Use Social Media?
More than 63% of internet users are on social media. And this number is growing with 4.1% per year.
😮 Fun Fact: The Global population is growing by 0.1% per year.
How Many People Use Social Media Daily?
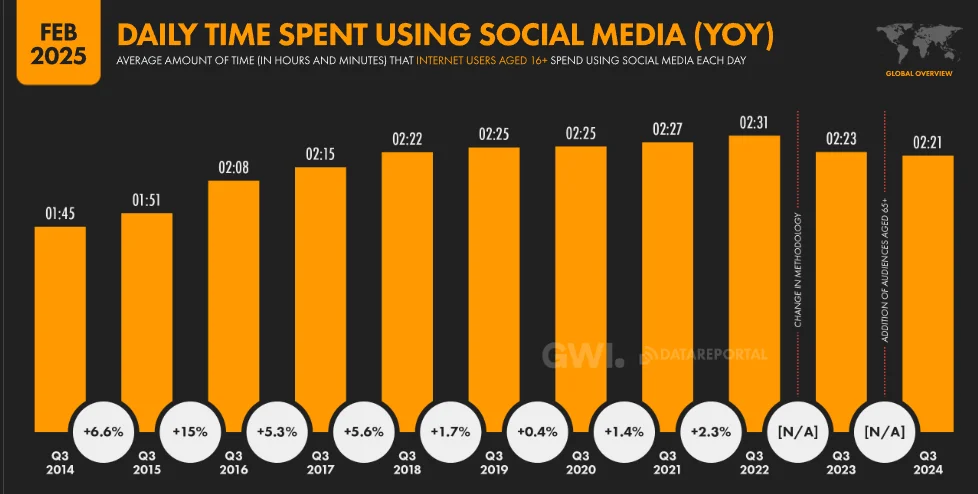
The average person spends 2 hours and 21 minutes scrolling every day.
😮 Fun Fact: In all age groups, females spend 20-30% more time on social media than males.
Social Media Statistics Overview: Breakdown by Platform

Not all social platforms are on the same level. Some are blowing up, while others are just trying to keep up. Here’s a quick breakdown to see where they stand:
| Platform | Active Users (in millions) | Avg. Time Per Month | Daily Open Rate |
| 3,065 | 17+ Hours | ~ 63% | |
| 2,000 | 16+ Hours | ~ 61% | |
| TikTok | 1,582 | 34+ Hours | ~ 64% |
| X.com | 611 | 5+ Hours | ~ 40% |
| 498 | 1.5+ Hours | ~ 27% |
1. Facebook: Still Holding the Throne
- 3+ billion monthly active users make it the largest platform.
- Facebook Groups are booming, with 1.8 billion users engaging in them monthly.
2. Instagram: The Go-To for Brands & Creators
- 2 billion monthly active users, with 500 million daily active users on Stories.
- Social commerce is huge, with 130 million users tapping on shopping posts monthly.
3. TikTok: The Gen Z’ Preference
- 1.5 billion monthly active users, with an average user spending 52 minutes daily on the app.
- 72% of Gen Z prefers TikTok over Instagram for video content.
4. Twitter (Now X): Real-Time Information Hub
- 600 million monthly active users, with 500 million tweets sent daily.
- Trending topics influence global conversations in politics, sports, and entertainment.
5. Pinterest: The Underrated Traffic Magnet
- 465 million monthly active users, with steady growth in e-commerce.
- 85% of weekly users use Pinterest to plan purchases.
- Pinterest ads have a 2x higher return on ad spend than other platforms.
Which Social Media Platform Do People Use For Brand Research?
If you’re not showing up where people are actually looking for brands, you’re basically handing customers to your competitors. Social media isn’t just for scrolling, it’s where buying decisions happen. So, pay attention to the platforms your audience is using for research, or you’ll end up invisible when it matters most.
| Platform | Users’ Research About Brand (in %) |
| ~ 52% | |
| ~ 62% | |
| TikTok | ~ 51% |
| X.com | ~ 37% |
| ~ 36% |
Who’s Using What? (Demographics Breakdown)

Knowing who’s on social media helps businesses, influencers, and marketers tap into the right audience with a strategy that actually works.
Millennials and Social Media Statistics:
- 69.2% of millennials actively use social media daily.
- Facebook, Instagram, and YouTube dominate millennial engagement.
Gen Z Social Media Statistics:
- 50% of Gen Z users spend 4+ hours daily on social media.
- TikTok and Snapchat are their top platforms.
Best Times to Post on Social Media in 2025
| Platform | Best Time | Best Day |
| 7 am – 9 am 1 pm – 3 pm 7 pm – 9 pm | Wednesday, Thursday | |
| 7 am – 9 am 11 pm – 2 am | Mid-week days | |
| Twitter (X.com) | 9 am – 11 am 1 pm | Wednesday, Thursday |
| TikTok | 10 am – 12 pm | Tuesday, Thursday |
| 8 pm4 pm9 pm | Sunday, Monday, Tuesday |
Social Media Trends in 2025: What’s Changing?

1. Social Commerce is exploding:
Social media isn’t just for engagement anymore, it’s a full-fledged marketplace. In 2025, social commerce revenue is projected to hit $1.08 trillion by 2028. That means more people are buying directly from social media platforms instead of going to external websites.
How You Can Use This Trend:
Set Up a Shop on Social Media: Selling something? Get a shoppable storefront on Instagram, Facebook, or TikTok. Use high-quality images, solid product descriptions, and real customer reviews to build trust.
Leverage Live Shopping: TikTok Shop and Instagram Live Shopping are game-changers. Hosting live sessions to showcase products in real time can seriously boost conversions.
Invest in Shoppable Ads: Ditch the traditional ads that send people to a website. Shoppable posts and ads let customers buy instantly with just a few taps.
Utilize User-Generated Content (UGC): People trust real reviews over branded content. Encourage customers to post photos and videos of your products and feature them in your store.
2. AI-Generated Content Is Everywhere
AI is reshaping how businesses create content. In 2025, brands are using AI tools like ChatGPT, Jasper, and Midjourney to generate content and images.
Also, AI-powered analytics are helping brands analyze audience behaviour and tweak strategies for better engagement and conversions.
How You Can Use This Trend:
Automate Content Creation: Use AI tools to generate social media captions, blog content, and product descriptions in minutes instead of hours.
Personalize Marketing Efforts: AI can analyze customer behavior and send personalized recommendations through DMs, emails, and ads.
Use AI chatbots: Platforms like Facebook Messenger and WhatsApp support AI-driven chatbots that answer FAQs, handle orders, and provide 24/7 customer support.
3. The Creator Economy is Thriving
The influencers, content creators, and independent entrepreneurs on social media are exploding. Brands are shifting away from traditional celebrity endorsements and teaming up with micro- and nano-influencers (those with smaller, highly engaged followings).
Also, many popular platforms are rolling out monetization programs that allow creators to earn directly from their content, making the space even more competitive.
How You Can Use This Trend:
Partner with Micro-Influencers: Instead of spending thousands on celebrities, collaborate with influencers who have 10k–100k followers in your niche. They have higher engagement rates and feel more authentic to their audience.
Launch an Affiliate Program: Set up a referral program where creators earn commissions for every sale they bring in. It’s a win-win for both sides.
Create a Brand Ambassador Program: Identify loyal customers and fans and invite them to represent your brand in exchange for exclusive perks and free products.
Special Discounts & Giveaways: Offer discounts and giveaways to customers who post about your brand on social media. This increases awareness, trust and credibility.
Final Thoughts: Don’t Just Watch, Take Action
By now, you already know that social media isn’t just entertainment anymore. It’s where businesses sell, engage, and grow. In 2025, success comes down to spotting trends early and adapting fast. Also, use free social media tools to analyze and streamline your content creation and publishing.
Whether you’re a brand, creator, or just someone trying to keep up, these numbers help you:
- Post smarter
- Market better
- Stay ahead
Use these statistics to level up your strategy before your competitors do.
Enjoy this data-driven blog? You may also like: The Future of ChatGPT Monetization.